Whats the importance of Maps?
Cartography or mapmaking has been an important part of the human history for a long time; possibly from past 8,000 years. It seems in ancient Babylon, Greece and Asia cave paining was used for exploration of newer terrains. In those days also people used to create and use maps as an essential tool to help them define, explain, and navigate their way through the world. Tough we have learnt map reading in our high schools; I am presenting here some vital details of map reading which I have found very useful in recent years.
Why do we use Maps?
Maps are one of the most important tools researchers, cartographers, tourists, students and others can use to examine the entire earth or a specific part of it. In simple words maps are pictures of the earth’s surface. They can be used as general reference to show landforms, political boundaries, water bodies, and the positions of cities.
What are the uses of Maps?
A map gives a minute depiction of a very large space. It acts as a guide in places which we have never visited before. They give us the distance in two places, mountains, rivers, railway station, airport, and shapes of places or destinations.
Purpose of a map
With a map, one does not have to depend on anybody for local directions. It acts as direction finder for a very small price.
The IT revolution has given way to GIS (Geographic Information Systems) it has become large domain within the broader academic discipline of Geoinformatics. The fact is – Geoinformatics due to spatial data infrastructure has no restrictive boundaries.
Different types of maps can show us a plethora of information existing on earth. Twenty years ago, we used paper maps and printed guides to help us navigate the world.
Today, the most advanced digital mapping technologies—satellite imagery, GPS devices, location data and of course Google Maps are much more accessible. This sea change in mapping technology is improving our lives and helping businesses realize untold competences and destinations. I today’s age it is essential for every business organization to have its online presence for its existence needs to be known to the world. Its presence needs to be found. And where do people go when they need to find something? It’s Google, and when we look out for something Google maps are most useful. They present the minutest detail to find out a location.
What are the different types of maps.
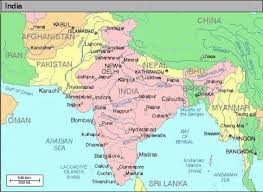
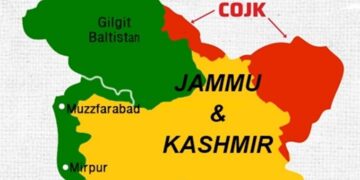
Definition of Political Map: A political map does not show any topographic features. It instead focuses solely on the state and national boundaries of a place. They also include the locations of cities – both large and small, depending on the detail of the map. A common type of political map would be World Atlas.
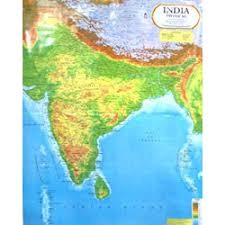
Definition of Physical Map: Physical maps often include much of the same data found on a political map, but their primary purpose is to show landforms like deserts, mountains and plains. Their topography style presents an overall better picture of the local terrain.
Uses of Physical Maps
Physical maps use color connotations to show physical landscape features of a place. They show rivers and lakes and water bodies with blue color. Mountains and elevation changes are usually shown with different colors and shades to show relief. Normally on physical maps green shows lower elevations while browns show high elevations.
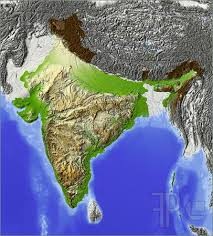
What is a Topographic Map: In modern mapping, a topographic map is a type of map characterized by large-scale detail and quantitative representation of break, using contour lines (outline) by using different methods.
Conventional definition of topographic map require a it to show both natural and man-made features. A topographic map is published as a map series which is made up of two or more map sheets that combine to form the whole map. A contour line is a combination of two line segments that connect but do not intersect; these represent elevation on a topographic map. Contour lines on topographic maps are normally spaced at regular intervals to show elevation changes. For example. each line represent a 100 foot (30 m) elevation change usually. When lines are close together the terrain is steep and when lines are little distanced they represent a reasonable terrain.
 Definition of Climate Map: They symbolize aspects of climate. They show the geographic distribution of the monthly or annual average values of climatic variables such as temperature, precipitation, relative humidity, percentage of possible sunshine, isolation, cloud cover, wind speed and direction, and atmospheric pressure over regions ranging in area from a few tens of square kilometers to global breadth. The climate map minimizes the bias in the data by averaging 30 years data; this it does to take into account one or two periods with abnormally high or low values.

Definition of Economic Map: An economic or resource map shows the specific type of economic activity or natural resources present in an area. This is shown through the use of different symbols or colors depending on what is being shown on the map. Economic Map shows branches of various production spheres. These maps are concerned with the trade, commerce, transport of goods, economic conditions etc of a country, a state or a city. These maps also show unemployment, energy resource usage, banking and commerce, and world trade.
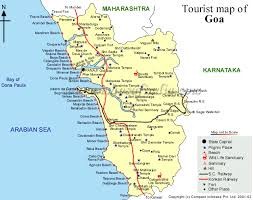 Definition of Road Map: A road map is one of the most widely used map types. These maps show major and minor highways and roads in details, as well as spots like railway station, airports, city locations and points of interest like parks, campgrounds, temples, churches and monuments. Major highways on a road map are generally red and larger than other roads. Minor roads are a lighter color and a narrower line. A road map primarily displays roads and transport links. It also shows political boundaries and labels, making it also a type of political map. The earliest road map was drawn around 1160 BC in ancient Egypt.
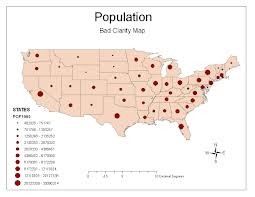
Definition of Thematic Map: An early contributor to thematic mapping was in England by the English Astronomer Edmond Halley. His first significant cartographic contribution was of a Star Chart of the constellation of the Southern Hemisphere, made during his stay at St. Helena and published in 1686. In that same year he also published his first terrestrial map in an article about trade winds, and this map is called the first meteorological chart. Another example of early thematic mapping was by London physician John Snow. In this map cholera disease had been mapped thematically. Snow’s cholera map in 1854 is the best known example of using thematic maps for analysis. Essentially, his technique and methodology anticipate principles of a geographic information system (GIS).
What does a Thematic map do?
A thematic map focuses on a particular theme or special topic. They do not just show natural features like rivers, cities, political subdivisions, elevation and highways. If these items are on a thematic map, they are background information and are used as reference points to enhance the map’s theme.
How to read Maps and develop map reading skills?
And, finally we all need to learn the map reading skills that is required to read and interpret maps. They fall under visual literacy because one needs to get habituated to read images. Visual literacy means not just decoding an image but also to comprehend it; grasping the image and its intentional meaning, evaluating it, and integrating it into other knowledge. Though it seems easy, map reading requires patience and a sharp approach to comprehend it.


